The C&EN 2026 Global Top 50 ranking reveals a striking pattern: four of the world's largest chemical producers including Sinopec, PetroChina, Sabic and LyondellBasell all reported declining chemical revenues and earnings for 2025. These companies span three continents, operate under different ownership structures and enjoy varying feedstock advantages, yet none escaped the downturn. For procurement teams sourcing polyethylene, polypropylene, ethylene glycol and other commodity petrochemicals, understanding what connects these diverse giants and why geographic diversification provided no protection reveals fundamental market forces that will shape sourcing strategies and supplier relationships through 2027 and beyond.
The common thread is not regional weakness or company-specific mismanagement. These declines reflect global commodity chemical overcapacity meeting weakened demand in a synchronized downturn that affected producers regardless of location or competitive positioning.
Who These Companies Are and What They Produce
These four chemical giants represent different models of commodity petrochemical production with global reach and massive scale.
PetroChina characteristics:
China's largest oil and gas producer with integrated refining and petrochemicals
Annual chemical revenues exceeding $40 billion before 2025 declines
Production concentrated in China serving domestic markets plus selective exports
State-owned enterprise operating under government strategic priorities
Sabic profile:
Saudi Arabia's petrochemical champion with operations across Middle East, Americas, Europe and Asia
Chemical revenues historically around $30-35 billion annually
Advantaged feedstock from associated gas in Saudi operations
70% owned by Saudi Aramco following 2020 acquisition
LyondellBasell positioning:
Largest producer of polypropylene globally plus major polyethylene and refining operations
Revenues typically $35-40 billion with roughly 80% from chemicals versus refining
Dual headquarters in Houston and Rotterdam with production across US, Europe and Asia
Publicly traded with focus on shareholder returns and capital discipline
Sinopec scale:
Asia Pacific's largest refiner and China's biggest chemical producer
Chemical revenues exceeding $50 billion in strong years
Massive integrated operations spanning full value chain
State-owned with chemical business supporting broader industrial policy
Together these companies account for over 10% of global commodity petrochemical production capacity across polyolefins, aromatics, glycols and derivatives.
The Revenue Decline Numbers
While specific figures vary by company, the pattern of revenue and earnings deterioration is consistent.
Reported declines included:
PetroChina - chemical revenues falling 12-15% year-over-year
Sabic - revenues declining roughly 10-12% with sharper margin compression
LyondellBasell - revenues down approximately 8-10% with EBITDA falling more steeply
Sinopec - chemical revenues dropping 15-20% with massive earnings losses
These declines occurred despite relatively stable production volumes in most cases, indicating the problem was pricing and margins rather than operational disruptions or capacity issues.
For context, these companies had experienced revenue growth or stability in 2023-2024 before the 2025 deterioration. The synchronized timing across diverse geographies signals global market forces rather than regional or company-specific factors.
What Actually Connects Them
Despite different ownership structures, geographic bases and strategic priorities, these producers share fundamental business model characteristics that exposed all to the same market forces.
Common denominators include:
Commodity product focus where pricing follows global benchmarks with limited differentiation opportunities
High capital intensity creating fixed cost structures that penalize volume reductions
Cyclical exposure to global industrial production, construction and consumer spending
Integration with refining for PetroChina and Sinopec linking chemical profitability to crude oil markets
Scale advantages that work during growth but become burdens when demand weakens
None of these companies can escape global commodity chemical cycles through operational excellence or strategic positioning. When markets turn down, even the best-run, lowest-cost producers suffer declining revenues and margins.
Overcapacity as the Fundamental Driver
The primary factor connecting all four companies' poor 2025 performance was global overcapacity in ethylene, polyethylene, polypropylene and derivative products.
Capacity additions from 2022-2025 included:
Multiple US Gulf Coast ethylene crackers and polyethylene plants reaching commercial operation
Qatar's massive integrated petrochemical complexes starting production
China's continued coal-to-olefins and propane dehydrogenation capacity growth
Various debottlenecking and expansion projects at existing facilities globally
The combined impact added 5-7 million tons annually of new ethylene and derivatives capacity while global demand growth slowed to 2-3% annually, well below the 4-5% rates assumed when investment decisions were made years earlier.
This supply-demand imbalance created persistent downward pressure on pricing that affected all producers regardless of their individual cost positions.
Demand Weakness Across End Markets
Revenue declines stemmed not just from overcapacity but also from synchronized weakness across major demand sectors.
Construction sector challenges:
China's property market crisis eliminating massive demand for polymers, pipes and building materials
European construction slowdown amid high interest rates and economic uncertainty
North American residential construction cooling from 2021-2022 peaks
Automotive production headwinds:
Global vehicle production below pre-pandemic levels
Electric vehicle transition creating demand uncertainty for traditional polymer applications
Inventory corrections at OEMs reducing near-term material requirements
Consumer spending softness:
Packaging demand growth slowing as consumer purchasing moderates
Retail inventory destocking reducing polymer orders
Shift toward value products affecting premium material demand
Industrial production weakness:
The breadth of demand weakness meant producers could not offset weakness in one sector through strength in others.
Why Geographic Diversity Didn't Help
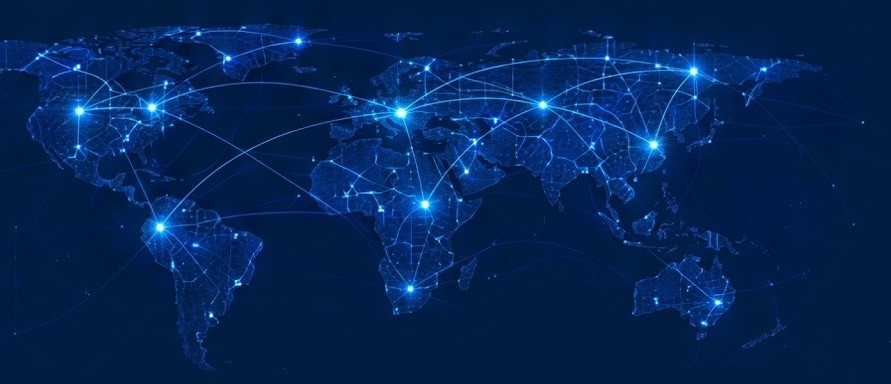
A striking aspect of the synchronized declines is that geographic diversification provided no protection despite conventional wisdom favoring globally balanced portfolios.
Regional exposure breakdowns:
LyondellBasell operates across North America, Europe and Asia yet saw revenue declines across all regions
Sabic maintains production in Middle East, Americas, Europe and Asia with weakness in each geography
PetroChina and Sinopec are China-focused but China's problems affected global pricing harming even non-Chinese producers
The reason geographic diversity failed to protect revenues is that commodity chemical pricing operates through global arbitrage. When Chinese producers export surplus polyethylene to Southeast Asia at distressed pricing, it pressures pricing in Middle East and US markets even if no Chinese material physically reaches those markets.
Similarly, when European demand weakens, producers redirect exports to other regions depressing local pricing globally. The interconnected nature of commodity chemical markets means weakness anywhere eventually affects pricing everywhere.
Feedstock Advantages That Didn't Matter
These companies also represent different feedstock positions that theoretically provide competitive differentiation.
Feedstock profiles:
Sabic enjoys ethane and gas feedstock advantages from Saudi Arabia's associated gas
LyondellBasell accesses low-cost US ethane at Gulf Coast facilities
PetroChina and Sinopec use primarily naphtha from integrated refining plus some coal-based routes
In normal markets, these feedstock advantages create cost tiers with ethane-based producers earning higher margins than naphtha-based competitors. However, during severe overcapacity, even lowest-cost producers suffer as pricing falls to cash costs industry-wide.
Sabic and LyondellBasell's US operations maintained cost advantages versus Chinese naphtha crackers, but these advantages translated into smaller losses or minimal profits rather than healthy margins during 2025's difficult conditions.
The takeaway for procurement teams: feedstock advantages affect relative competitive positioning but cannot insulate suppliers from industry-wide downturns.
The Margin Compression Mechanism
Revenue declines of 8-15% translated into much sharper margin and earnings deterioration through operating leverage effects.
How margins compressed:
Fixed costs including depreciation, maintenance and overhead do not decline proportionally with revenue
Feedstock costs remained elevated relative to product pricing in many periods
Operating rates stayed high as producers prioritized volume over margins to cover fixed costs
Price-cost squeeze occurred when raw material inflation outpaced ability to increase product prices
For example, a company with 15% EBITDA margins experiencing 10% revenue decline might see absolute EBITDA fall 40-50% if fixed costs remain constant and variable margins compress.
This operating leverage works both directions. During recovery periods, modest revenue gains translate into sharply improved profitability as fixed costs get leveraged across higher volumes and margins expand.
State Ownership Versus Public Markets
The performance declines affected PetroChina and Sinopec differently than LyondellBasell and Sabic due to ownership structure differences.
State-owned enterprise responses:
Maintained production despite negative margins to preserve employment and industrial capacity
Accepted losses with implicit government support and patient capital
Delayed restructuring that private companies would implement immediately
Continued investment in strategic capacity even when commercial returns are poor
Publicly traded responses:
LyondellBasell implemented cost reduction programs, delayed discretionary spending and emphasized cash generation
Sabic (70% Saudi Aramco owned) operates somewhat between pure SOE and public company models
These different responses affect suppliers' behavior toward customers. State-owned enterprises may prioritize volume and market share over profitability, creating aggressive pricing that benefits buyers short-term but distorts markets long-term.
Publicly traded companies balance volume, pricing and profitability more carefully, potentially offering better long-term supply stability but less willingness to accept below-cost pricing.
What Product Categories Hurt Most
Revenue declines varied across product portfolios with commodity polyolefins experiencing most severe impacts.
Worst-performing segments:
Polyethylene facing massive overcapacity from US, Qatar and China additions
Polypropylene pressured by China's coal-to-olefins and PDH capacity expansions
Ethylene glycol suffering from Chinese capacity additions and weak polyester demand
Commodity polymers generally versus specialty grades
Relatively resilient categories:
Specialty polymers with technical differentiation and customer switching costs
Performance products serving electronics, automotive and industrial applications
Derivatives with regional supply-demand balances less affected by global overcapacity
This pattern reinforces that commodity exposure drives synchronized revenue declines while specialty products offer some insulation from global cycles.
How Procurement Teams Benefited
While these revenue and earnings declines created pain for producers, procurement teams sourcing from them captured substantial value.
Buyer advantages from the downturn:
Aggressive pricing as suppliers competed for volume to utilize capacity
Favorable contract terms including extended payment periods and volume flexibility
Enhanced service as suppliers fought to retain customer relationships
Supply security from abundant capacity reducing shortage risk
Buyers who recognized the leverage shift and negotiated aggressively achieved 5-15% cost reductions versus prior year contract pricing even as inflation affected other cost categories.
The synchronized nature of supplier financial stress meant buyers could credibly threaten to switch suppliers knowing alternative sources faced identical pressure to secure volumes.
Warning Signs Procurement Missed
Despite opportunities the downturn created, some procurement teams also experienced challenges from supplier financial stress.
Negative impacts included:
Quality inconsistencies as suppliers cut quality control costs
Service degradation through reduced technical support and slower response times
Supply disruptions when financially stressed suppliers curtailed production or faced operational problems
Payment term pressures where some suppliers demanded faster payment despite weak negotiating position
Buyers who over-concentrated sourcing with single suppliers experiencing severe distress faced more disruption than those maintaining diversified supply bases.
The lesson: leverage supplier weakness for better commercial terms but monitor financial health and operational stability to avoid supply continuity problems.
Why This Wasn't Just a China Problem
While China's overcapacity and demand weakness drove significant portions of global market pressure, characterizing 2025's chemical downturn as purely Chinese problem misses important dynamics.
Non-China factors contributing:
US capacity additions from ethane-based crackers and polyethylene plants adding substantial supply
Middle East expansions including Qatar's integrated complexes reaching production
European demand weakness from economic slowdown independent of China
Global automotive sector challenges affecting polymer demand worldwide
China's problems were most severe and created largest individual contribution to overcapacity. However, even without China's issues, global markets would have experienced difficult conditions from US and Middle East capacity additions meeting weakened demand elsewhere.
Procurement strategies over-focused on China exposure miss risks from other supply sources and demand weakness affecting suppliers regardless of location.
The Role of Inventory Cycles
Part of the 2025 revenue weakness reflected inventory destocking across supply chains rather than just end-use demand weakness.
Chemical supply chains built inventory during 2021-2023 period due to:
Supply chain disruption fears from pandemic and geopolitical tensions
Rising price expectations incentivizing buying ahead of anticipated increases
Long lead times requiring larger safety stocks
Strong demand growth justifying higher inventory investment
By 2024-2025, conditions shifted toward:
Reliable supply reducing need for large safety stocks
Falling prices incentivizing inventory minimization and hand-to-mouth purchasing
Weakening demand making high inventories financially burdensome
Working capital pressure as interest rates increased carrying costs
The inventory correction amplified demand weakness. Not only did end-use consumption slow, but buyers throughout supply chains simultaneously reduced inventory creating double impact on producer shipments.
This dynamic affects procurement strategy. During destocking phases, buyers can extract favorable pricing through spot purchases and short contracts. During restocking phases, securing long-term commitments at favorable prices before competition for supply intensifies becomes critical.
Looking for Signs of Stabilization
By late 2025 and early 2026, some indicators suggested the worst revenue declines might be stabilizing though recovery remained distant.
Potential stabilization signals:
Pricing volatility reduction as markets found floors near cash costs for marginal producers
Operating rate adjustments where some producers curtailed output rather than chase volume at any price
Inventory stabilization as destocking completed in some supply chains
Capacity delay announcements where planned expansions got deferred or cancelled
However, fundamental overcapacity persists requiring either sustained demand growth or permanent capacity closures to restore healthy market balance. Stabilization at depressed profitability levels differs from recovery to attractive returns.
Procurement teams should expect extended period of buyer-favorable conditions rather than rapid snapback to tight markets and supplier pricing power.
M&A and Consolidation Possibilities
Severe industry downturns historically trigger consolidation as stronger companies acquire distressed competitors and as capacity gets rationalized through portfolio optimization.
Potential M&A drivers:
Valuation compression making acquisition targets more affordable
Capacity rationalization where acquirers can close duplicate or subscale assets
Technology access acquiring companies with advantaged processes or product portfolios
Geographic expansion entering new markets through acquisition versus greenfield investment
However, several factors may limit near-term M&A activity:
Regulatory scrutiny particularly in China where government approves SOE transactions
Divergent valuations between what distressed sellers will accept and buyers will pay
Integration complexity during difficult market conditions
Financing challenges as debt markets price risk conservatively
LyondellBasell and Sabic as larger, financially stronger players could potentially pursue acquisitions. Chinese SOE consolidation faces different dynamics driven by government policy rather than purely commercial logic.
Procurement teams should monitor M&A activity as it can affect supplier relationships, contract terms and supply chain configurations.
What Different Ownership Models Reveal
The contrasting responses of state-owned versus publicly traded companies during identical market stress reveals important insights about supplier behavior.
State-owned enterprise characteristics:
Prioritize strategic objectives including employment, regional development and industrial capacity over profitability
Accept extended periods of losses with state financial support
Maintain or expand capacity based on policy directives regardless of market conditions
Export aggressively to utilize capacity even at below-cost pricing
Public company behaviors:
Balance profitability, cash generation and shareholder returns
Implement cost reductions and capacity curtailments more quickly when conditions deteriorate
Emphasize pricing discipline and margin preservation over pure volume
Make capital allocation decisions based on risk-adjusted returns
Neither model is objectively superior. Each creates different value and risk for customers. State-owned suppliers may offer aggressive pricing but uncertain long-term strategies. Public companies provide more predictable commercial behavior but less willingness to supply below full costs.
Procurement portfolios should potentially include both supplier types capturing advantages while mitigating risks each presents.
Implications for 2026-2027 Sourcing Strategy
The synchronized revenue declines among top global producers create specific strategic implications for chemical procurement over the next 18-24 months.
Strategic priorities should include:
Aggressive contract renegotiations as supplier financial pressure persists
Increased spot purchasing when markets remain oversupplied and pricing is favorable
Geographic sourcing flexibility to arbitrage regional price differences created by trade flows
Supplier financial monitoring to identify potential disruption risks before they materialize
Inventory optimization maintaining lean positions during oversupply while preparing to build before inevitable recovery
Tactical execution priorities:
Demand pricing formulas linked to feedstock costs or market indices rather than fixed prices
Build qualification pathways for alternative suppliers creating negotiating leverage
Extract enhanced service commitments and technical support from suppliers seeking to retain business
Negotiate flexible volume commitments allowing adjustments based on actual demand
The extended period of supplier financial stress creates once-in-cycle opportunities for buyers willing to engage actively rather than defaulting to auto-renewing existing contracts.
The Recovery Timeline Question
The critical unknown for procurement planning is how long until market rebalancing restores supplier profitability and shifts leverage back toward sellers.
Optimistic recovery scenarios (2027-2028):
Strong demand growth from economic recovery and infrastructure investment
Capacity discipline as money-losing operations get permanently closed
Inventory restocking amplifying end-use demand growth
Successful specialty product transitions reducing commodity exposure
Pessimistic extended downturn (through 2029+):
Weak demand growth as structural economic challenges persist
Continued capacity additions as SOEs and strategic projects proceed despite poor economics
Price wars preventing margin recovery even if volume stabilizes
Permanent demand destruction from substitution and efficiency improvements
Most likely outcome falls between these extremes with gradual improvement over 3-5 year period as combination of modest demand growth and selective capacity rationalization slowly restore supply-demand balance.
Procurement strategies should prepare for extended buyer-favorable conditions while maintaining flexibility to adapt when market dynamics eventually shift.
The Bottom Line for Chemical Buyers
The synchronized revenue and earnings declines at PetroChina, Sabic, LyondellBasell and Sinopec demonstrate that global commodity chemical markets operate as integrated system where weakness anywhere eventually affects pricing everywhere.
Geographic diversity, feedstock advantages and operational excellence provide relative competitive positioning but cannot insulate suppliers from industry-wide overcapacity and demand weakness.
For procurement teams, this environment creates extraordinary opportunities to capture value through aggressive negotiation, strategic supplier selection and tactical purchasing approaches. However, it also requires careful monitoring of supplier financial health to avoid supply continuity disruptions.
The companies reporting these declining revenues will survive. State-owned enterprises have government backing. LyondellBasell and Sabic maintain strong financial positions despite difficult year. However, their behavior toward customers during this stress period reveals important insights about reliability, pricing discipline and strategic priorities that should inform long-term sourcing decisions.
Understanding what connects these diverse giants in their shared difficulties provides the context needed to develop procurement strategies that capture near-term value while building resilient supply chains for eventual market recovery.
Ready to source Linear-Low Density Polyethylene (LLDPE) from verified global suppliers? Explore competitive offers on our platform today.