
Chemical Demand Forecasting: Using Trade Data to Identify Market Growth Opportunities
Chemical demand forecasting can help businesses identify a growing market before rising purchasing activity turns into stronger competition and higher sourcing costs. For chemical traders, importers and procurement managers, international trade data provides valuable signals about where demand is developing and which products could offer new commercial opportunities.
Chemical demand forecasting combines historical trade movements, import and export volumes, product prices and regional market activity to estimate future purchasing requirements. Instead of relying entirely on market assumptions or supplier recommendations, businesses can use measurable trade patterns to guide their decisions.
For companies operating across international chemical markets, this approach supports better inventory planning, supplier selection and market expansion. It also helps businesses recognise changes in customer demand early enough to adjust their sourcing strategies.
How Chemical Demand Forecasting Works
Chemical demand forecasting uses historical and current market information to estimate how much of a chemical product buyers may require over a specific period. Trade data plays an important role because it shows how products move between countries and how international purchasing patterns change over time.
Businesses can examine several indicators to develop a clearer picture of demand:
Import volumes: Increasing import quantities may indicate stronger domestic consumption, industrial expansion or greater dependence on overseas suppliers.
Export performance: Rising exports can reveal growing production capacity and opportunities for suppliers to serve international buyers.
Trade values: Changes in the monetary value of imports and exports help businesses understand market activity alongside physical quantities.
Trading partners: New or expanding trade relationships can highlight emerging sourcing destinations and previously underserved markets.
Product-level movements: Individual chemical categories can reveal demand changes that broader industry statistics might conceal.
The objective is not simply to identify which chemicals have the highest trade volumes. Businesses need to understand why those volumes change, whether the movement reflects genuine consumption growth and whether the trend can continue.
Why Trade Data Matters for Identifying Market Growth
Trade data offers a practical way to evaluate market opportunities across different countries, industries and chemical categories. It allows procurement teams to compare actual import activity rather than depending exclusively on general industry commentary.
The United Nations Comtrade database provides international merchandise trade statistics by product and trading partner, covering approximately 200 countries and representing more than 99% of global merchandise trade. This gives businesses a broad foundation for evaluating international chemical trade movements.
Consider a trader evaluating opportunities in sodium hydroxide. If several countries consistently increase their imports while domestic production remains limited, those markets may present opportunities for international suppliers.
However, rising trade values do not automatically indicate stronger demand. A business should also examine physical quantities, average unit values, domestic production and changes in industrial consumption before deciding whether a market offers sustainable growth.
Trade data becomes particularly useful when companies compare several years of activity. A single increase may reflect temporary stock replenishment, while consistent growth across multiple reporting periods can indicate a more established purchasing trend.
Key Trade Indicators That Reveal Emerging Demand
A reliable forecasting strategy combines multiple indicators instead of depending on one market measurement. Each indicator answers a different question about the direction and strength of chemical demand.
1. Import volume growth
Import volume provides one of the clearest signals of purchasing activity. When a country imports increasing quantities of a chemical over several periods, businesses should investigate whether local industries are expanding or domestic production is struggling to meet requirements.
2. Import value and unit prices
Trade value measures the monetary scale of imports, while unit value helps estimate the average value per traded quantity. If import value increases but physical volume remains stable, price changes rather than additional consumption may explain the movement.
3. Supplier concentration
A market that depends heavily on a small group of exporting countries may offer opportunities for alternative suppliers. Procurement teams can investigate whether buyers would benefit from additional sourcing options, shorter lead times or more competitive commercial terms.
4. Changes in trading partners
New supplier countries or expanding trade relationships can indicate changing procurement preferences. These movements may reflect competitive pricing, improved logistics, trade agreements or changes in regional manufacturing capacity.
5. Seasonal and monthly patterns
Some chemicals experience predictable purchasing cycles because of agricultural seasons, construction activity or manufacturing schedules. Monthly trade statistics help businesses distinguish recurring seasonal demand from unexpected market growth.
Combining these indicators creates a stronger foundation for identifying markets with genuine commercial potential.
How Businesses Can Turn Trade Data Into Growth Opportunities
Trade statistics become commercially valuable when companies translate them into practical decisions. A structured analysis process helps traders and procurement managers move from broad market observations to specific sourcing and expansion strategies.
The following approach can support this process:
Select relevant chemical products: Identify products based on existing trading activities, customer requirements or potential industrial applications. Use the appropriate Harmonized System (HS) codes to retrieve comparable trade records.
Compare historical performance: Review at least three to five years of available data to identify long-term movements. Include monthly information where reporting coverage allows.
Identify high-growth destinations: Compare import quantities across countries and calculate changes over time. Prioritise markets with sustained growth rather than isolated increases.
Evaluate existing supply sources: Determine which countries currently supply the selected markets and whether buyers depend on a limited number of exporters.
Investigate market conditions: Examine local production, industrial activity, infrastructure, tariffs and regulatory requirements to understand what drives import demand.
Estimate commercial potential: Compare expected purchasing requirements with supplier availability, freight costs and competitive pricing.
Monitor market developments: Update the analysis regularly and adjust forecasts when new trade information becomes available.

Which Markets Offer Stronger Chemical Demand Potential?
Not every country with high chemical import volumes represents an attractive opportunity. Businesses need to distinguish between established high-volume markets and smaller markets experiencing faster growth.
A large industrial economy may offer consistent purchasing requirements but also attract substantial competition from established chemical producers. A smaller developing economy may have lower overall imports but experience faster growth because of new manufacturing facilities or expanding infrastructure projects.
Several market characteristics deserve attention:
Industrial expansion: Countries investing in construction, automotive manufacturing, textiles, packaging and agricultural processing may require increasing quantities of industrial chemicals, polymers and specialty ingredients.
Import dependency: Markets with limited domestic chemical production often rely on international suppliers. This dependency can create opportunities for exporters who offer reliable quality and competitive delivery terms.
Infrastructure development: New industrial zones, manufacturing facilities and transportation projects can increase demand for construction chemicals, coatings, polymers and water-treatment products.
Changing production requirements: Manufacturers may switch to alternative raw materials because of cost pressures, environmental requirements or changing product specifications. These transitions can create new sourcing opportunities.
For example, increasing imports of monoethylene glycol may indicate stronger purchasing activity from polyester and related manufacturing industries. Similarly, rising demand for titanium dioxide could reflect expanding requirements across coatings, plastics and other applications.
These relationships help traders connect trade statistics with the industrial activities that generate chemical demand.
Data Sources and Tools for Chemical Trade Analysis
Businesses do not need an expensive research department to begin analysing international chemical trade. Several established platforms provide access to trade statistics that companies can use for market screening and demand forecasting.
UN Comtrade: Provides international import and export statistics by product, reporting country, trading partner and period. Its API also supports data extraction for businesses that want to integrate trade information into internal analytical systems.
UN Comtrade Help Center+1
International Trade Centre Trade Map: Offers yearly and monthly trade statistics that help businesses evaluate international market performance and compare trading opportunities.
MAT Portal
World Trade Organization (WTO) Data Portal: Provides trade-related indicators and country-level information that can support broader international market comparisons.
WTO Data Portal
National customs and trade portals: Country-specific platforms can provide additional information about import movements, reporting periods and domestic trading activity.
Businesses can combine these sources with spreadsheets, SQL databases or business intelligence software to organise historical records and identify important changes.
For instance, a procurement team could maintain a database containing chemical names, HS codes, importing countries, exporting countries, annual quantities and trade values. Regular updates would allow analysts to compare market performance without rebuilding the entire dataset for every review.
Common Challenges in Trade-Based Demand Forecasting
Although trade data provides valuable market intelligence, businesses must interpret it carefully. International statistics contain limitations that can affect forecasting accuracy.
Differences in product classification: Chemical products may appear under different levels of HS classification. Some codes cover multiple related substances, making it difficult to isolate demand for a specific grade or formulation.
Incomplete reporting: Countries do not always publish trade information at the same time or with the same level of detail. Missing periods can distort comparisons between markets.
Price fluctuations: Rising trade values may result from higher chemical prices, currency movements or freight-related cost changes rather than increased consumption.
Re-exports and transit trade: Some countries import chemicals and subsequently export them to other destinations. Their import figures may therefore reflect regional distribution activity rather than domestic consumption alone.
Inventory adjustments: Buyers may increase imports temporarily to build inventory ahead of expected shortages or price increases. Such purchases do not necessarily indicate long-term demand growth.
External market disruptions: Geopolitical developments, shipping delays, energy prices and regulatory changes can quickly alter established supply relationships.
To manage these challenges, analysts should standardise product classifications, compare quantities and values separately and cross-check trade movements against industry-specific information.
Building More Reliable Chemical Demand Forecasts
Historical trade performance provides a useful starting point, but businesses also need forecasting methods that account for changing market conditions. A practical forecasting model should combine historical purchasing patterns with industry developments and commercial intelligence.
Three approaches can help businesses improve their forecasts:
Trend-based forecasting: This method uses historical import and export movements to estimate future demand. Analysts can calculate annual growth rates and examine whether purchasing activity follows a consistent upward or downward direction.
Seasonal forecasting: Businesses can use monthly trade records to identify recurring purchasing cycles. This approach works particularly well for chemicals linked to agricultural production, seasonal construction and manufacturing schedules.
Scenario-based forecasting: Companies can prepare different demand scenarios based on possible changes in industrial output, raw material prices, shipping conditions or trade policies. This helps procurement managers prepare for both favourable and challenging market conditions.
For better results, businesses should compare forecast estimates with actual purchasing activity as new information becomes available. Tracking forecast errors also helps analysts identify weaknesses in their assumptions and improve future projections.
What Procurement Teams Should Do Now
Chemical demand forecasting should become part of regular procurement and market intelligence activities rather than an occasional research exercise. Companies that consistently monitor trade movements can identify changing buyer requirements, evaluate supplier alternatives and respond to market developments with greater confidence.
Procurement managers and chemical traders can strengthen their decisions by focusing on a few practical priorities:
Build product-specific intelligence: Monitor import and export movements for the chemicals that matter most to your business.
Explore alternative markets: Identify countries with increasing import requirements and evaluate whether your existing supplier network can serve them.
Track competitive sourcing options: Compare exporting countries, supplier concentration and available trade routes before entering a new market.
Connect forecasts with purchasing plans: Use expected demand movements to guide inventory levels, supplier negotiations and contract planning.
Review market information regularly: Update forecasts as new trade statistics, industry developments and customer purchasing signals become available.
The strongest opportunities often emerge when businesses connect international trade statistics with practical knowledge of chemical applications, industrial requirements and supply chain conditions. This combination allows traders to identify potential customers, procurement teams to anticipate purchasing needs and exporters to focus on markets with developing demand.
As international chemical supply chains continue to evolve, businesses that use trade intelligence systematically can make more informed decisions about where to source, what to stock and which markets to approach next. Ready to source chemicals from verified global suppliers? Explore competitive offers on our platform today.
Sources:
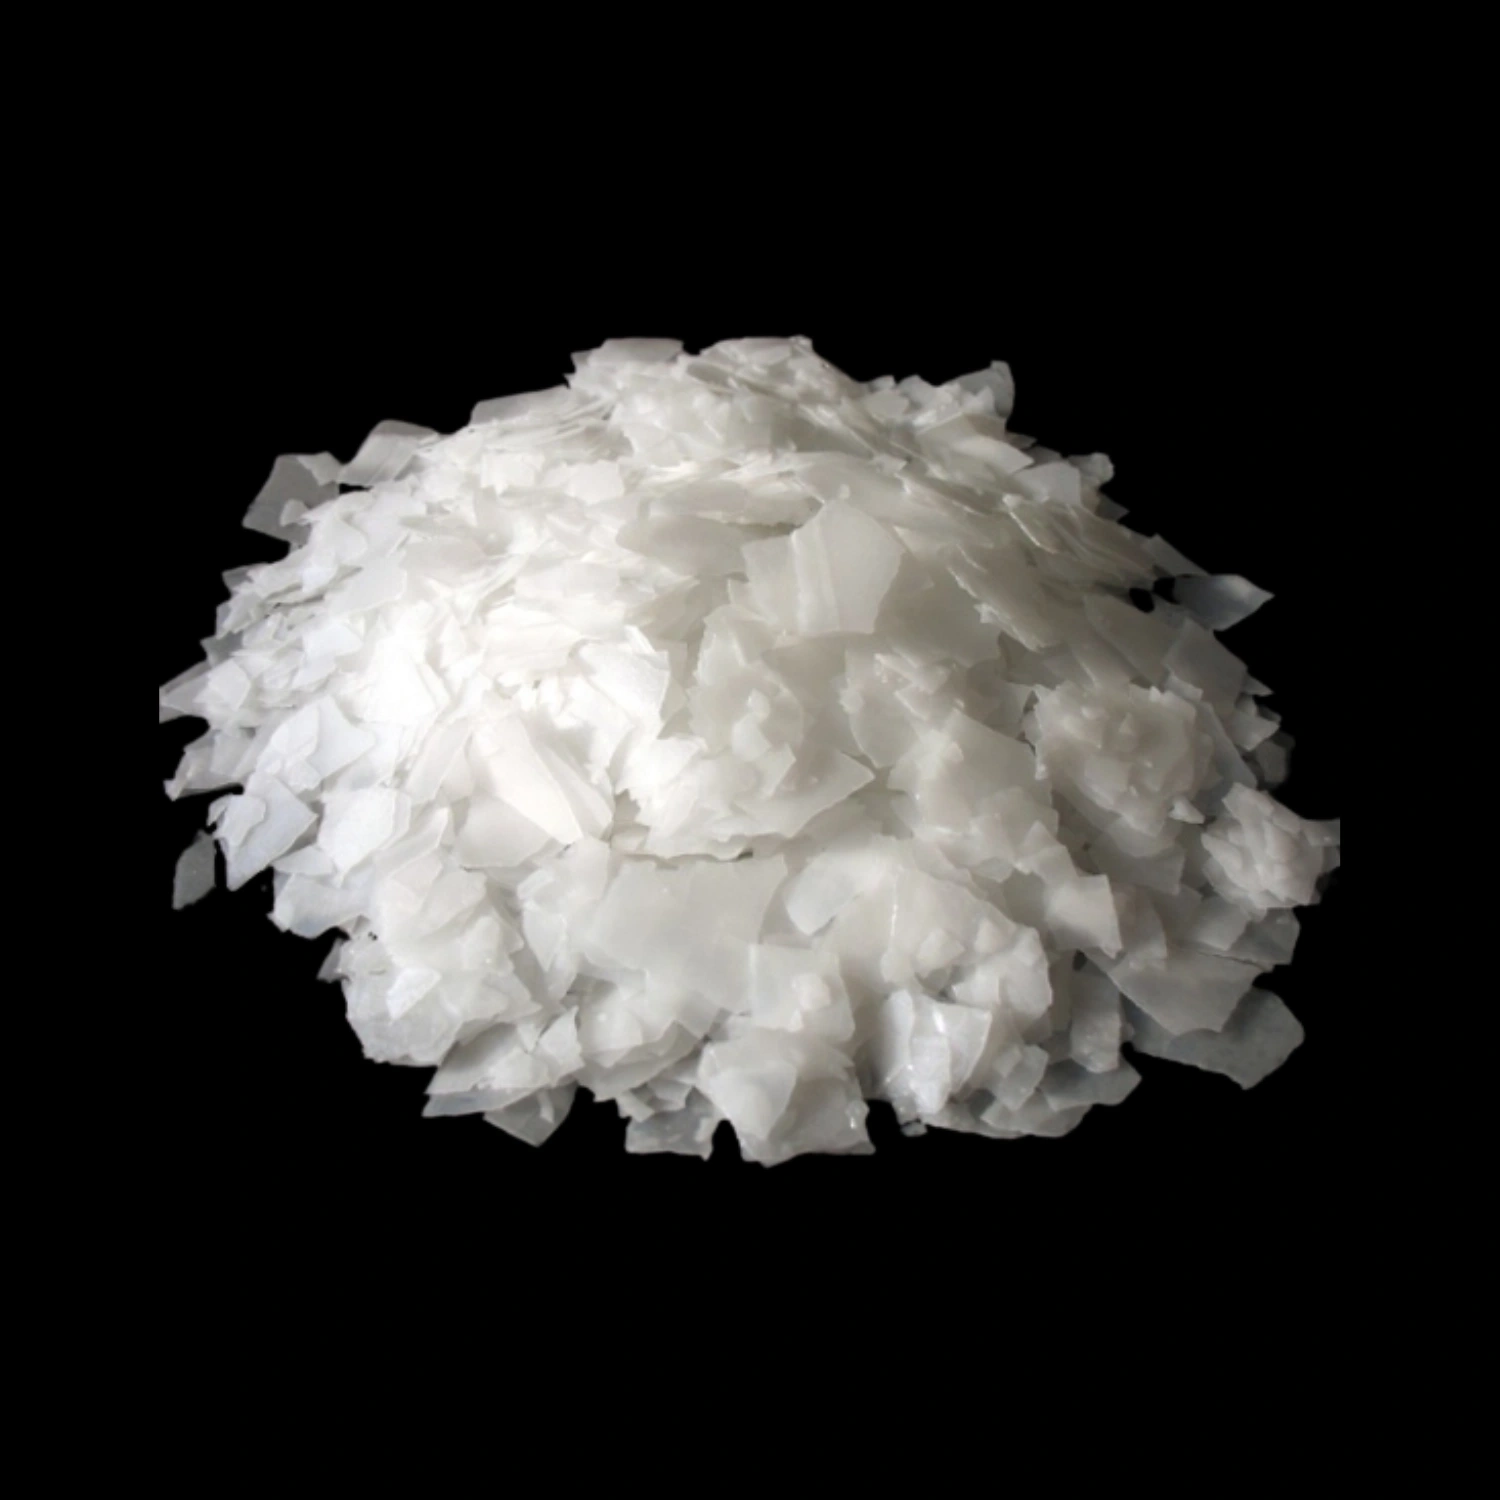
Caustic Soda Flakes
Found this useful?