Ranking the 3M Settlement Against DuPont's Within the Combined New Jersey Deal
New Jersey's PFAS litigation provides an unusually useful comparison point between two of the world's largest chemical companies: 3M and the DuPont-related group of DuPont, Chemours and Corteva.
Within the broader settlement framework, the 3M portion is reported at approximately $400 million to $450 million, while the DuPont-related entities' agreement is valued at $875 million.
The comparison illustrates how PFAS settlement economics can vary substantially depending on the scope of claims, historical operations, alleged contamination, payment structure, and corporate liability allocation.
For chemical-market intelligence teams, comparing the two agreements offers a useful benchmark for evaluating the financial significance of major environmental settlements.
The Headline Comparison
At headline value, the two settlement figures are:
Company / Group | Reported Settlement Value | Relative Scale |
|---|---|---|
DuPont, Chemours & Corteva | $875 million | Larger |
3M | $400–450 million | Smaller |
Difference | $425–475 million | DuPont-related group higher |
The DuPont-related settlement is therefore roughly 2 times the size of the 3M settlement at the midpoint of the reported 3M range.
However, headline value alone does not establish which company faces the greater underlying economic burden.
Why the Comparison Matters
PFAS litigation is not a single uniform liability category.
Claims can involve:
Drinking-water contamination
Groundwater
Surface water
Natural-resource damages
Industrial sites
Product-related exposure
Remediation
Historical manufacturing activity
The geographic scope and legal theory behind each case can therefore produce very different settlement values.
Comparing settlement amounts without examining those differences can lead to misleading conclusions.
The DuPont-Related $875 Million Agreement
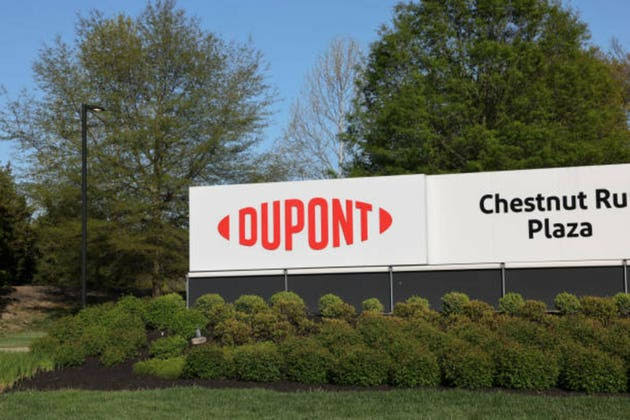
The New Jersey agreement involving DuPont, Chemours and Corteva is valued at $875 million.
The settlement addresses environmental claims brought by New Jersey, including PFAS-related claims.
Importantly, the $875 million is not a DuPont-only liability.
The payment responsibility is divided among the three companies.
Reuters reported that Chemours would make half of the settlement payments, while DuPont would bear 35.5% and Corteva the remaining share.
The agreement also uses a long-term payment structure, making the economic impact different from an immediate lump-sum settlement.
The 3M Portion
3M's New Jersey settlement is smaller on a headline basis, at approximately $400 million to $450 million.
The amount should similarly be evaluated alongside:
Payment timing
Scope of claims
Covered sites
Releases provided
Other PFAS liabilities
Existing reserves
Insurance recovery
A smaller settlement does not necessarily mean lower overall PFAS exposure.
3M has faced extensive PFAS litigation in other jurisdictions and has separately entered into major agreements concerning public-water-system claims.
A Critical Intelligence Distinction
The most important analytical distinction is:
Settlement value ≠ total corporate PFAS exposure.
A company's total exposure may include:
Settled claims
Pending litigation
Future remediation
Insurance recoveries
Indemnification
Regulatory obligations
Unresolved private claims
Consequently, the New Jersey comparison should be treated as a single-jurisdiction benchmark, not a complete ranking of 3M versus DuPont's total PFAS liabilities.
Why DuPont's Figure Is Particularly Complex
The DuPont-related settlement involves three companies because of the historical restructuring of DuPont's businesses.
That creates additional analytical questions around:
Liability allocation
Spin-off agreements
Indemnification
Insurance
Historical operations
Successor liability
Therefore, the $875 million headline figure should not be attributed directly to DuPont.
The actual financial burden is distributed across the corporate group.
Why 3M's PFAS Exposure Is Also Difficult to Measure
3M's PFAS exposure is similarly broader than one settlement.
The company has faced claims from:
U.S. states
Municipal water systems
Individual plaintiffs
Government agencies
International jurisdictions
Its liabilities can therefore extend far beyond the New Jersey agreement.
This makes the settlement useful as a benchmark but insufficient as a standalone measure of total financial risk.
Payment Duration Changes the Economics
A settlement paid over many years has a different economic value from a settlement paid immediately.
Analysts should therefore examine:
Annual payment amount
Payment duration
Escalation provisions
Discounted present value
Accounting recognition
Cash-flow impact
For example, a large nominal settlement paid over decades may impose less immediate liquidity pressure than a smaller settlement requiring a large upfront payment.
The Scope of Contamination Matters
Settlement amounts can also reflect the geographic and environmental scope of alleged contamination.
Relevant variables include:
Number of sites
Number of affected communities
Water systems involved
Contaminant concentrations
Remediation requirements
Natural-resource damages
A company with a smaller settlement may still face significant unresolved liabilities elsewhere.
Comparing the Two Companies More Broadly
A useful intelligence framework is:
Factor | 3M | DuPont-related group |
New Jersey settlement | ~$400–450M | $875M |
Corporate structure | Primarily 3M | DuPont + Chemours + Corteva |
Broader PFAS litigation | Extensive | Extensive |
Payment structure | Case-specific | Long-term settlement |
Allocation complexity | Lower | Higher |
Historical liability structure | Significant | Highly complex |
New Jersey headline value | Smaller | Larger |
The table highlights why the raw settlement numbers only tell part of the story.
What the Difference Could Signal
The roughly $425–475 million difference between the two headline figures may reflect differences in:
Alleged contamination scope
Historical chemical production
Site footprint
Environmental claims
Settlement negotiations
Corporate liability allocation
Payment schedules
It should not automatically be interpreted as evidence that the DuPont-related group caused twice as much contamination as 3M.
Settlement values are negotiated legal outcomes, not direct measurements of environmental damage.
Settlement Negotiations Are Not Scientific Rankings
This point is particularly important for chemical-market analysis.
A settlement amount can be influenced by:
Litigation risk
Cost of defense
Probability of adverse judgment
Corporate ability to pay
Desire for certainty
Insurance
Negotiating leverage
Scope of the release
Therefore, ranking companies by settlement value is useful for financial intelligence, but not necessarily for ranking environmental responsibility.
Implications for Chemical Investors
Investors should use settlement comparisons to evaluate:
Cash-flow commitments
Legal uncertainty
Reserve adequacy
Insurance recoveries
Long-term liability
Corporate restructuring risk
The more useful question is not simply:
"Who paid more?"
It is:
"What percentage of each company's broader PFAS exposure has actually been resolved?"
Implications for Chemical M&A
PFAS settlements can also influence chemical-sector transactions.
Potential buyers of businesses with historical PFAS exposure may need to examine:
Environmental liabilities
Indemnification agreements
Insurance
Historical manufacturing records
Settlement releases
Pending litigation
A settlement can reduce uncertainty while simultaneously making remaining liabilities easier to quantify.
Implications for Procurement Teams
Large environmental settlements do not automatically create supply-chain problems.
However, procurement teams should monitor whether legal costs influence:
Capital spending
Asset sales
Plant closures
Portfolio restructuring
R&D budgets
Supplier investment
This is particularly important when sourcing from companies undergoing major restructuring or litigation.
A Better PFAS Settlement Ranking
For future chemical-sector comparisons, settlement intelligence should rank cases using several metrics:
1. Headline Settlement Value
The nominal value announced.
2. Company-Specific Allocation
How much the individual company is actually responsible for.
3. Payment Duration
How long the company will make payments.
4. Present Value
The economic value of future payments in today's dollars.
5. Claims Released
How much litigation risk is actually eliminated.
6. Remaining Exposure
What claims remain unresolved.
This approach provides a much stronger comparison than simply ranking settlement headlines.
The Broader New Jersey Benchmark
The New Jersey agreements are particularly useful because they provide a rare opportunity to compare major PFAS manufacturers within the same state litigation environment.
The comparison highlights the importance of:
Corporate history
Chemical production
Site exposure
Legal strategy
Settlement negotiations
Corporate restructuring
It also demonstrates why chemical litigation intelligence should track case-specific facts rather than relying exclusively on headline dollar values.
Looking Ahead
The New Jersey comparison between 3M and the DuPont-related group provides a useful benchmark for understanding the scale and complexity of PFAS settlements.
The $875 million DuPont-related agreement is materially larger than 3M's roughly $400–450 million settlement, but that difference should not be treated as a direct measure of relative environmental responsibility or total PFAS exposure.
For investors, the key variables are allocation, payment timing, reserves, insurance, and remaining litigation.
For chemical companies, the case demonstrates how environmental liabilities can remain intertwined with corporate structures for decades.
For procurement teams, the broader lesson is that major litigation should be incorporated into supplier-risk monitoring without assuming that a settlement automatically indicates operational weakness.
Ultimately, the most valuable intelligence comes from moving beyond the headline:
How much was announced, who actually pays, what claims were released, and how much exposure remains?
Key Takeaways
New Jersey provides a useful side-by-side PFAS settlement benchmark for 3M and the DuPont-related group.
3M's reported settlement is approximately $400–450 million, compared with $875 million for DuPont, Chemours and Corteva.
The DuPont-related $875 million figure is a group settlement, not a DuPont-only liability.
Settlement value should not be confused with total corporate PFAS exposure or environmental responsibility.
Payment duration, allocation, insurance, and remaining claims materially affect the economic significance of a settlement.
A negotiated settlement reflects litigation and commercial considerations as well as the underlying environmental claims.
Investors should compare resolved exposure with remaining liabilities rather than ranking companies solely by settlement value.
Procurement teams should monitor whether major litigation affects capital allocation, asset strategy, or supplier continuity.
Glacial Acetic Acid (E260)
Found this useful?