

Grading 23 Chemical Producers on Their First Ever Sector Specific Carbon Performance Score
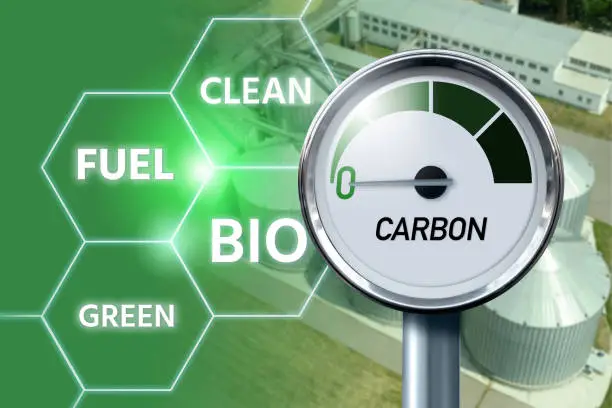
Grading 23 Chemical Producers on Their First-Ever Sector-Specific Carbon Performance Score
The chemical industry's decarbonization debate is entering a more measurable phase. Rather than evaluating producers only on headline net-zero commitments, investors and buyers are increasingly asking a more practical question: which chemical companies are actually reducing emissions at a pace consistent with their sector's transition requirements?
A first sector-specific carbon performance assessment covering 23 chemical producers provides a useful framework for making that comparison. The importance of such a score is not simply the ranking itself. It is the shift toward evaluating companies against sector-specific emissions pathways, capital allocation and operational progress rather than generic corporate climate commitments.
Why Sector-Specific Scoring Matters
Chemical companies cannot be compared fairly with banks, retailers or technology companies using the same carbon-performance assumptions.
The chemical industry is highly energy- and feedstock-intensive. Emissions arise from:
Fuel and electricity consumption
Steam generation
Hydrogen production
Chemical feedstocks
Petrochemical cracking
Process emissions
Purchased materials
Downstream product use
As a result, a chemical producer can reduce operational emissions while still carrying a substantial Scope 3 footprint through fossil-based feedstocks.
A sector-specific score attempts to capture this complexity.
From Climate Commitments to Measurable Performance
Most large chemical producers have announced some form of:
Net-zero target
2030 emissions-reduction target
Renewable-energy commitment
Carbon-capture project
Low-carbon product strategy
Circularity target
But targets alone do not demonstrate performance.
A more useful assessment separates companies into several dimensions:
Category | What It Measures |
|---|---|
Emissions trajectory | Actual reduction in Scope 1 and 2 emissions |
Carbon intensity | Emissions relative to production/output |
Scope 3 exposure | Upstream and downstream emissions |
Capital allocation | Investment in decarbonization |
Technology deployment | CCS, electrification, hydrogen, renewables |
Target credibility | Whether targets are backed by concrete actions |
Transition execution | Projects reaching FID and operation |
This provides a much clearer picture of who is progressing and who is primarily making commitments.
The 23-Company Comparison
A sector-specific score can be structured around a 100-point framework:
25 points — Operational emissions performance
How quickly has the company's Scope 1 and 2 emissions intensity improved?
20 points — Transition pathway
Is the company's 2030/2050 pathway aligned with the requirements of a lower-carbon chemical sector?
15 points — Scope 3 management
Does the company actively address feedstock, purchased-product and downstream emissions?
15 points — Decarbonization investment
How much capital is actually being directed toward lower-carbon production?
10 points — Technology deployment
Are carbon capture, renewable power, electrification, hydrogen and other technologies moving beyond pilot stage?
10 points — Target credibility
Are targets supported by clear milestones, budgets and implementation plans?
5 points — Transparency
Does the company provide sufficiently detailed and comparable emissions information?
The result is a score that evaluates execution rather than ambition alone.
Why Large Announced Projects Should Not Receive Full Credit
One of the most important lessons from the chemical industry's recent decarbonization cycle is that announced projects and operating projects are not equivalent.
A company can announce:
1 million tonnes/year of low-carbon production
but that does not necessarily mean:
1 million tonnes/year of actual emissions reductions.
The project may still be waiting for:
FID
Financing
Permits
Customer offtake
Infrastructure
Technology validation
This distinction is particularly relevant in 2026 as several major projects have been delayed or cancelled.
Dow's Path2Zero project, for example, has been delayed, demonstrating that even flagship decarbonization investments can be affected by market conditions and capital discipline.
Therefore, a robust carbon score should award significantly more points for verified operating reductions than for announced future capacity.
Scope 1 and Scope 2 Are Only Part of the Picture
The chemical sector has a particularly complicated Scope 3 challenge.
Consider a polymer producer:
Natural gas/oil → cracker → ethylene → polymer → packaging → consumer → waste
The producer can reduce its plant emissions through renewable electricity while the feedstock remains fossil-based.
Its Scope 1 and Scope 2 performance may therefore improve considerably without eliminating the fundamental carbon intensity of its products.
This makes Scope 3 particularly important when comparing chemical companies with different business models.
A diversified specialty-chemicals company may have a very different emissions profile from an integrated petrochemical producer even if both report similar Scope 1 and 2 reductions.
Carbon Intensity Can Reveal Hidden Differences
Absolute emissions can also be misleading.
A company that expands production may increase its total emissions while simultaneously reducing emissions per tonne of product.
For this reason, the score should ideally include both:
Absolute emissions
and
Emissions intensity.
For example:
Company | Absolute Emissions | Emissions Intensity | Interpretation |
|---|---|---|---|
A | ↓ 10% | ↓ 15% | Strong improvement |
B | ↑ 5% | ↓ 12% | Expansion with efficiency gains |
C | ↓ 2% | ↓ 2% | Limited progress |
D | ↑ 8% | ↑ 3% | Weak transition performance |
This prevents companies from receiving misleading scores simply because production volumes changed.
The Technology Divide Is Becoming Visible
The strongest performers are likely to be companies that have moved beyond a single decarbonization technology.
Chemical companies are increasingly building portfolios around:
Renewable electricity + electrification + hydrogen + carbon capture + circular feedstocks + energy efficiency
rather than relying on one solution.
This matters because different chemical processes have different decarbonization constraints.
For some facilities, electrification may be the lowest-cost solution.
For others, hydrogen may be more appropriate.
For high-concentration process emissions, CCS may remain essential.
For polymer producers, recycled or bio-based feedstocks can address part of the carbon footprint.
Capital Allocation Is the Real Test
Perhaps the most revealing component of a sector-specific score is capital allocation.
A company may have an ambitious 2050 net-zero target, but if almost all new investment continues to flow into conventional fossil-based capacity, the credibility of that target becomes weaker.
Investors should therefore examine:
Where is the next dollar of capital going?
A company investing heavily in:
Low-carbon production
Renewable energy
Electrification
Carbon capture
Circular feedstocks
Energy-efficient assets
is making a different strategic choice from a company primarily expanding conventional production.
The score should capture that difference.
Delayed Projects Should Affect the Score
The 2026 environment also demonstrates why project execution needs to be incorporated into carbon performance assessments.
A project that moves from:
Announcement → FID → construction → commissioning
should receive progressively greater confidence.
Conversely:
Announcement → delay → cancellation
should reduce the company's transition-execution score.
This creates a more dynamic assessment of corporate decarbonization.
What a Strong Performer Looks Like
A high-scoring chemical producer would ideally demonstrate:
Consistent reduction in operational emissions.
Declining emissions intensity despite production growth.
Clear Scope 3 strategy.
Large-scale decarbonization projects reaching FID.
Significant low-carbon capital expenditure.
Credible 2030 milestones.
Transparent progress reporting.
Limited dependence on unproven technologies.
Customer commitments for low-carbon products.
Evidence that decarbonization is integrated into business strategy.
The important point is that no single metric is sufficient.
What a Weak Performer Looks Like
A low-scoring company may show the opposite pattern:
Strong net-zero rhetoric
Limited absolute emissions reductions
Rising fossil-feedstock dependence
Heavy reliance on future offsets
Large numbers of announced but uncommitted projects
Weak Scope 3 disclosure
Delayed decarbonization investments
Little evidence of customer willingness to pay for low-carbon products
Such a company may technically have a climate strategy, but its actual transition trajectory remains uncertain.
Why Chemical Buyers Should Care
This type of scoring is not only relevant to investors.
Chemical procurement teams can use similar frameworks when selecting suppliers.
A buyer increasingly needs to know:
Supplier A: cheaper product, high carbon intensity.
Supplier B: slightly higher price, substantially lower product carbon footprint.
If the buyer has its own Scope 3 targets, the second supplier may create greater long-term value even when its initial price is higher.
This introduces a new dimension to chemical procurement:
Price + quality + availability + reliability + carbon intensity.
Carbon Performance Could Become a Procurement Metric
The next stage could see chemical buyers incorporating supplier carbon scores directly into sourcing decisions.
For example:
Procurement Factor | Weight |
|---|---|
Price | 35% |
Quality | 20% |
Supply reliability | 15% |
Lead time | 10% |
Carbon intensity | 15% |
Transparency | 5% |
This would effectively turn corporate carbon performance into a commercial variable.
Companies with strong carbon performance could gain preferred-supplier status, while high-carbon producers may face increasing pressure to provide discounts or transition plans.
The Bigger Industry Shift
The significance of grading 23 chemical producers is therefore larger than producing a league table.
It represents a shift from:
"Who has the most ambitious climate target?"
to:
"Who is actually changing the carbon intensity of chemical production?"
That distinction is becoming increasingly important as the industry enters a period of capital discipline.
If decarbonization projects compete directly with conventional capacity expansion for investment, companies will have to demonstrate that lower-carbon production can deliver both emissions reductions and economic returns.
Outlook
A sector-specific carbon performance score can become a powerful tool for investors, customers and procurement teams because it converts complex climate information into a comparable framework.
But the quality of the ranking will depend on methodology. Companies should not receive equivalent credit for a 2050 ambition, a funded project, an FID-stage project and an operating emissions reduction.
The strongest methodology should therefore prioritize verified performance and capital deployment, while treating long-term announcements as lower-confidence indicators.
For the chemical industry, this marks an important evolution.
The question is no longer simply whether a producer has a net-zero strategy.
It is whether its actual emissions trajectory, capital allocation, technology deployment and product portfolio demonstrate that the strategy is becoming reality.

Ascorbic Acid
Found this useful?