Global Petrochemical Demand Forecast: Emerging Trends in Production and Consumption
The International Energy Agency expects the petrochemical sector to consume about 17% of global crude oil by 2030, or one barrel in every six. The global petrochemical demand forecast is clear on direction: consumption keeps rising, and petrochemicals now lead oil demand growth.
Supply grows even faster in some regions. Analysts at BNEF estimate that ethylene capacity will exceed demand by 20.7% by 2030, and propylene capacity by 26.6%.
That mix of firm demand and heavy surplus defines the market. This article explains the main trends in production and consumption and what they mean for buyers and traders.
Oil Demand Growth Now Runs Through Petrochemicals
The IEA’s Oil 2025 report says petrochemicals will become the dominant source of oil demand growth from 2026 onwards. It projects average annual oil use by the sector to rise about 2.1% between 2024 and 2030.
Plastics sit at the centre of that growth. The IEA has previously noted that plastics demand almost doubled over 18 years and outpaced every other bulk material, including steel and aluminium.
Longer-term estimates are higher still. One industry briefing cites forecasts that plastics demand in 2050 could be two to 3.5 times recent levels.
Consumption Growth Shifts to Emerging Economies
Most new demand comes from outside the developed world. The IEA says emerging economies will drive the increase as they develop and urbanise.
Rising incomes lift spending on packaging, appliances, construction materials and vehicles. Each of these uses polyethylene, polypropylene, PVC or PET in large volumes.
Mature markets grow more slowly. Europe and Japan face weak industrial demand, and their consumption mainly follows factory output and consumer spending.
Feedstock Shapes Who Produces
Cheap feedstock decides where new plants succeed. The IEA notes that the US has seen the largest rise in natural gas liquids output, which lifted US and Chinese use of ethane and LPG for petrochemicals.
US ethane demand rose by 790,000 barrels per day between 2019 and 2024. That growth gives American producers a cost edge over naphtha-based plants in Europe and Asia.
Three feedstock routes compete today:
Ethane: the lowest-cost route, common in the US and the Middle East.
Naphtha: the main route in Europe and much of Asia, with higher and more volatile costs.
Coal and methanol: a growing route in China, which uses it to cut reliance on imported oil.
Capacity Growth Outruns Demand
Capacity expansion has outrun consumption. One analysis estimates that global ethylene capacity will rise 46% between 2022 and 2030.
ICIS expects ethylene operating rates to average 80% across 2022 to 2030, compared with 88% in 2000 to 2021. For propylene it expects 72%, down from 81%.
New plants keep arriving. McKinsey counted about 8 million tonnes per year of ethylene capacity that started up between April and July 2026 alone.
China Moves From Importer to Competitor
China shapes the market more than any other country. Oliver Wyman estimates that China builds about 70% of new chemical capacity through 2027.
The effect shows in trade. McKinsey reports that China’s net polyethylene imports fell by about 6 million tonnes per year in 2026 compared with 2025, and that Chinese chemical exports rose 17% from March to July.
Exporters elsewhere feel the squeeze. Producers that once relied on Chinese demand now compete with Chinese offers in their own markets, which weighs on prices.
Closures and Project Delays Start to Rebalance
The industry has begun to respond. Bain expects the sector to need a net closure of about 7.5% of olefin capacity by 2030, equal to 35 million tonnes, before utilization returns to historical levels.
Europe leads the closures, and new project announcements have slowed globally. Burns & McDonnell notes that fewer petrochemical projects reached announcement despite solid long-term fundamentals.
Rebalancing will take years. Closures in one region do not offset new plants in another, so surplus conditions should persist through the decade.
Sustainability Adds Cost and Pressure
Chemicals and petrochemicals make up about 6.1% of global emissions by end use. That puts the sector under pressure from regulators and customers.
Producers invest in lower-carbon routes, including bio-based feedstock and recycled content. These grades cost more, so they will grow from a small base.
Regulation can also reshape trade. Carbon rules and plastics policy can raise costs for producers in some regions and open gaps for others.
What Buyers Should Do Now
Plan for firm consumption and soft prices. Strong demand growth supports volume, while surplus capacity limits price increases in most commodity grades.
Use that leverage with care. Run tenders across several origins, link contract prices to published indices and keep terms short enough to benefit from further softening.
Protect against shocks too. Qualify a second source outside your main region, track feedstock and shipping costs weekly, and add clauses for trade measures and force majeure. Surplus markets can tighten quickly when a supply route closes.
Source link
https://www.polymerupdate.com/News/Details/1398489
https://oilprice.com/Energy/Crude-Oil/IEA-Plastics-Will-Replace-Fuels-As-Oil-Demand-Drivers.amp.html
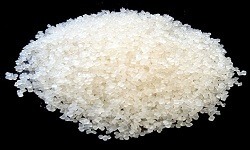
Linear-Low Density Polyethylene (LLDPE)
Found this useful?