Sodium Bicarbonate Price Trends: Industrial Demand and Regional Pricing Factors
Sodium Bicarbonate Price Trends: Industrial Demand and Regional Pricing Factors
Global Price Landscape
Food and beverage remains demand anchor, mostly baking and leavening, at 30 to 35 percent of global consumption, followed well back by pharmaceuticals, animal feed, personal care, and smaller but growing flue gas desulfurization outlet.
About 406 dollars a tonne globally as of Q2 2026. Regional spread runs from roughly 284 dollars per MT in China to higher levels in import-dependent markets. Sodium bicarbonate China FOB at 177.78 dollars per MT August 2026, showing low-cost base in China due to domestic soda ash availability.
Sodium bicarbonate markets showed mixed movement during Q2 2026, with stable Asian supply contrasting with firmer pricing in several import-dependent markets. Demand from food, pharmaceuticals, detergents, glass and industrial applications remained steady, supporting pricing despite soft demand in some chemical chains.
Sodium bicarbonate price trend in second quarter of 2026 showed clear upward movement across most global markets. Technical grade sodium bicarbonate recorded particularly strong price increases in Southeast Asia, where industrial demand and supply chain pressures worked together. Thailand recorded strongest quarterly increase among monitored markets, with technical grade prices rising by approximately 26% during Q2 2026.
Baking soda price trend moved higher across most global markets during Q2 2026, with strongest increases seen in parts of Asia and Europe. Demand from food processing, pharmaceuticals, chemicals, and industrial users remained fairly steady. Largest quarterly increase among markets covered seen in Thailand where technical-grade prices rose around 26%, Singapore followed with increase approximately 22%, Belgium, Turkey, Spain, India, Indonesia also recorded noticeable increases.
Industrial Demand – Food Anchor And Growing Flue Gas Use
Food and beverage applications dominate end-use demand with estimated 40-50% share in many developing markets, followed by cleaning products, pharmaceuticals, and detergents. Pakistan baking soda market projected to expand at compound annual growth rate of 4-6% through 2035, driven by population growth 2-2.5% annually, rising urbanization, and expanding food processing, pharmaceutical, and detergent sectors that collectively account for majority of domestic consumption. Food and beverage applications dominate end-use demand with 40-50% share.
Bangladesh baking soda market shows food and beverage processing accounts for estimated 35-45% of total demand, driven by bakery, confectionery, and beverage manufacturing, while feed additives and pharmaceutical applications together represent another 23-34% of consumption. Market volume projected to expand by 60-90% between 2026 and 2035, implying compound growth rate in 5-7% range.
Cote d'Ivoire baking soda market volume could expand by 30-50% between 2026 and 2035, implying mid-single-digit compound growth range of 4-6% annually, supported by population growth, urbanization, food-processing investment, and rising household adoption of packaged consumer products. Retail consumer packs in 500g and 1kg formats gaining shelf space in modern trade.
Nigeria baking soda market volume growth likely to run in mid-single digits approximately 5-8% annually through 2035, driven by food processing expansion, population growth roughly 2.5% per year, and rising household adoption as low-cost cleaning and cooking input. Food and beverage applications anchor demand at estimated 35-45% share, followed by household cleaning at 20-30%.
Secondary segments most notably detergents and cleaning at 184.59 million dollars 22.24% and chemical processing at 141.16 million 17.01% show importance beyond food. Flue gas desulfurization outlet growing, driven by environmental regulations requiring SO2 removal from power plants and industrial boilers, where sodium bicarbonate offers low-temperature alternative to lime.
Regional Pricing Factors
Pronounced regional price dispersion – 0.18 dollars per kg in Northeast Asia versus 0.56 dollars per kg in Europe and 0.54 dollars per kg in North America continues to influence sourcing strategies and supplier positioning across markets. That dispersion reflects soda ash feedstock costs, energy, and logistics.
Northeast Asia at 0.18 dollars per kg unchanged, Europe at 0.46 dollars per kg down 6.1%, North America at 0.54 dollars per kg down 1.8% in September 2026, showing mixed trend after Q2 increases. Sodium bicarbonate price trend in China became firmer during Q2 2026 with prices increasing around 8%, then declined around 2% in June, showing volatility.
Technical grade material recorded particularly strong gains in markets such as Thailand and Singapore, with Thailand up 26% and Singapore up 22% due to industrial demand and supply chain pressures. Spain recorded increase as well, Belgium, Turkey, India, Indonesia also recorded noticeable increases, reflecting higher energy costs, rising logistics expenses, changes in regional supply conditions, and steady demand.
Food grade export prices increased by around 8% over quarter, similar to technical grade but with premium for purity and compliance. Food grade requires low heavy metal, compliance to FCC, and GFSI certification, adding fixed cost component.
Sodium bicarbonate price trend moved higher across many global markets during Q2 2026, quarter shaped by higher energy costs, rising logistics expenses, changes in regional supply conditions, and steady demand from industries such as food processing, pharmaceuticals, and chemicals.
Production Costs – Soda Ash And Energy Linkage
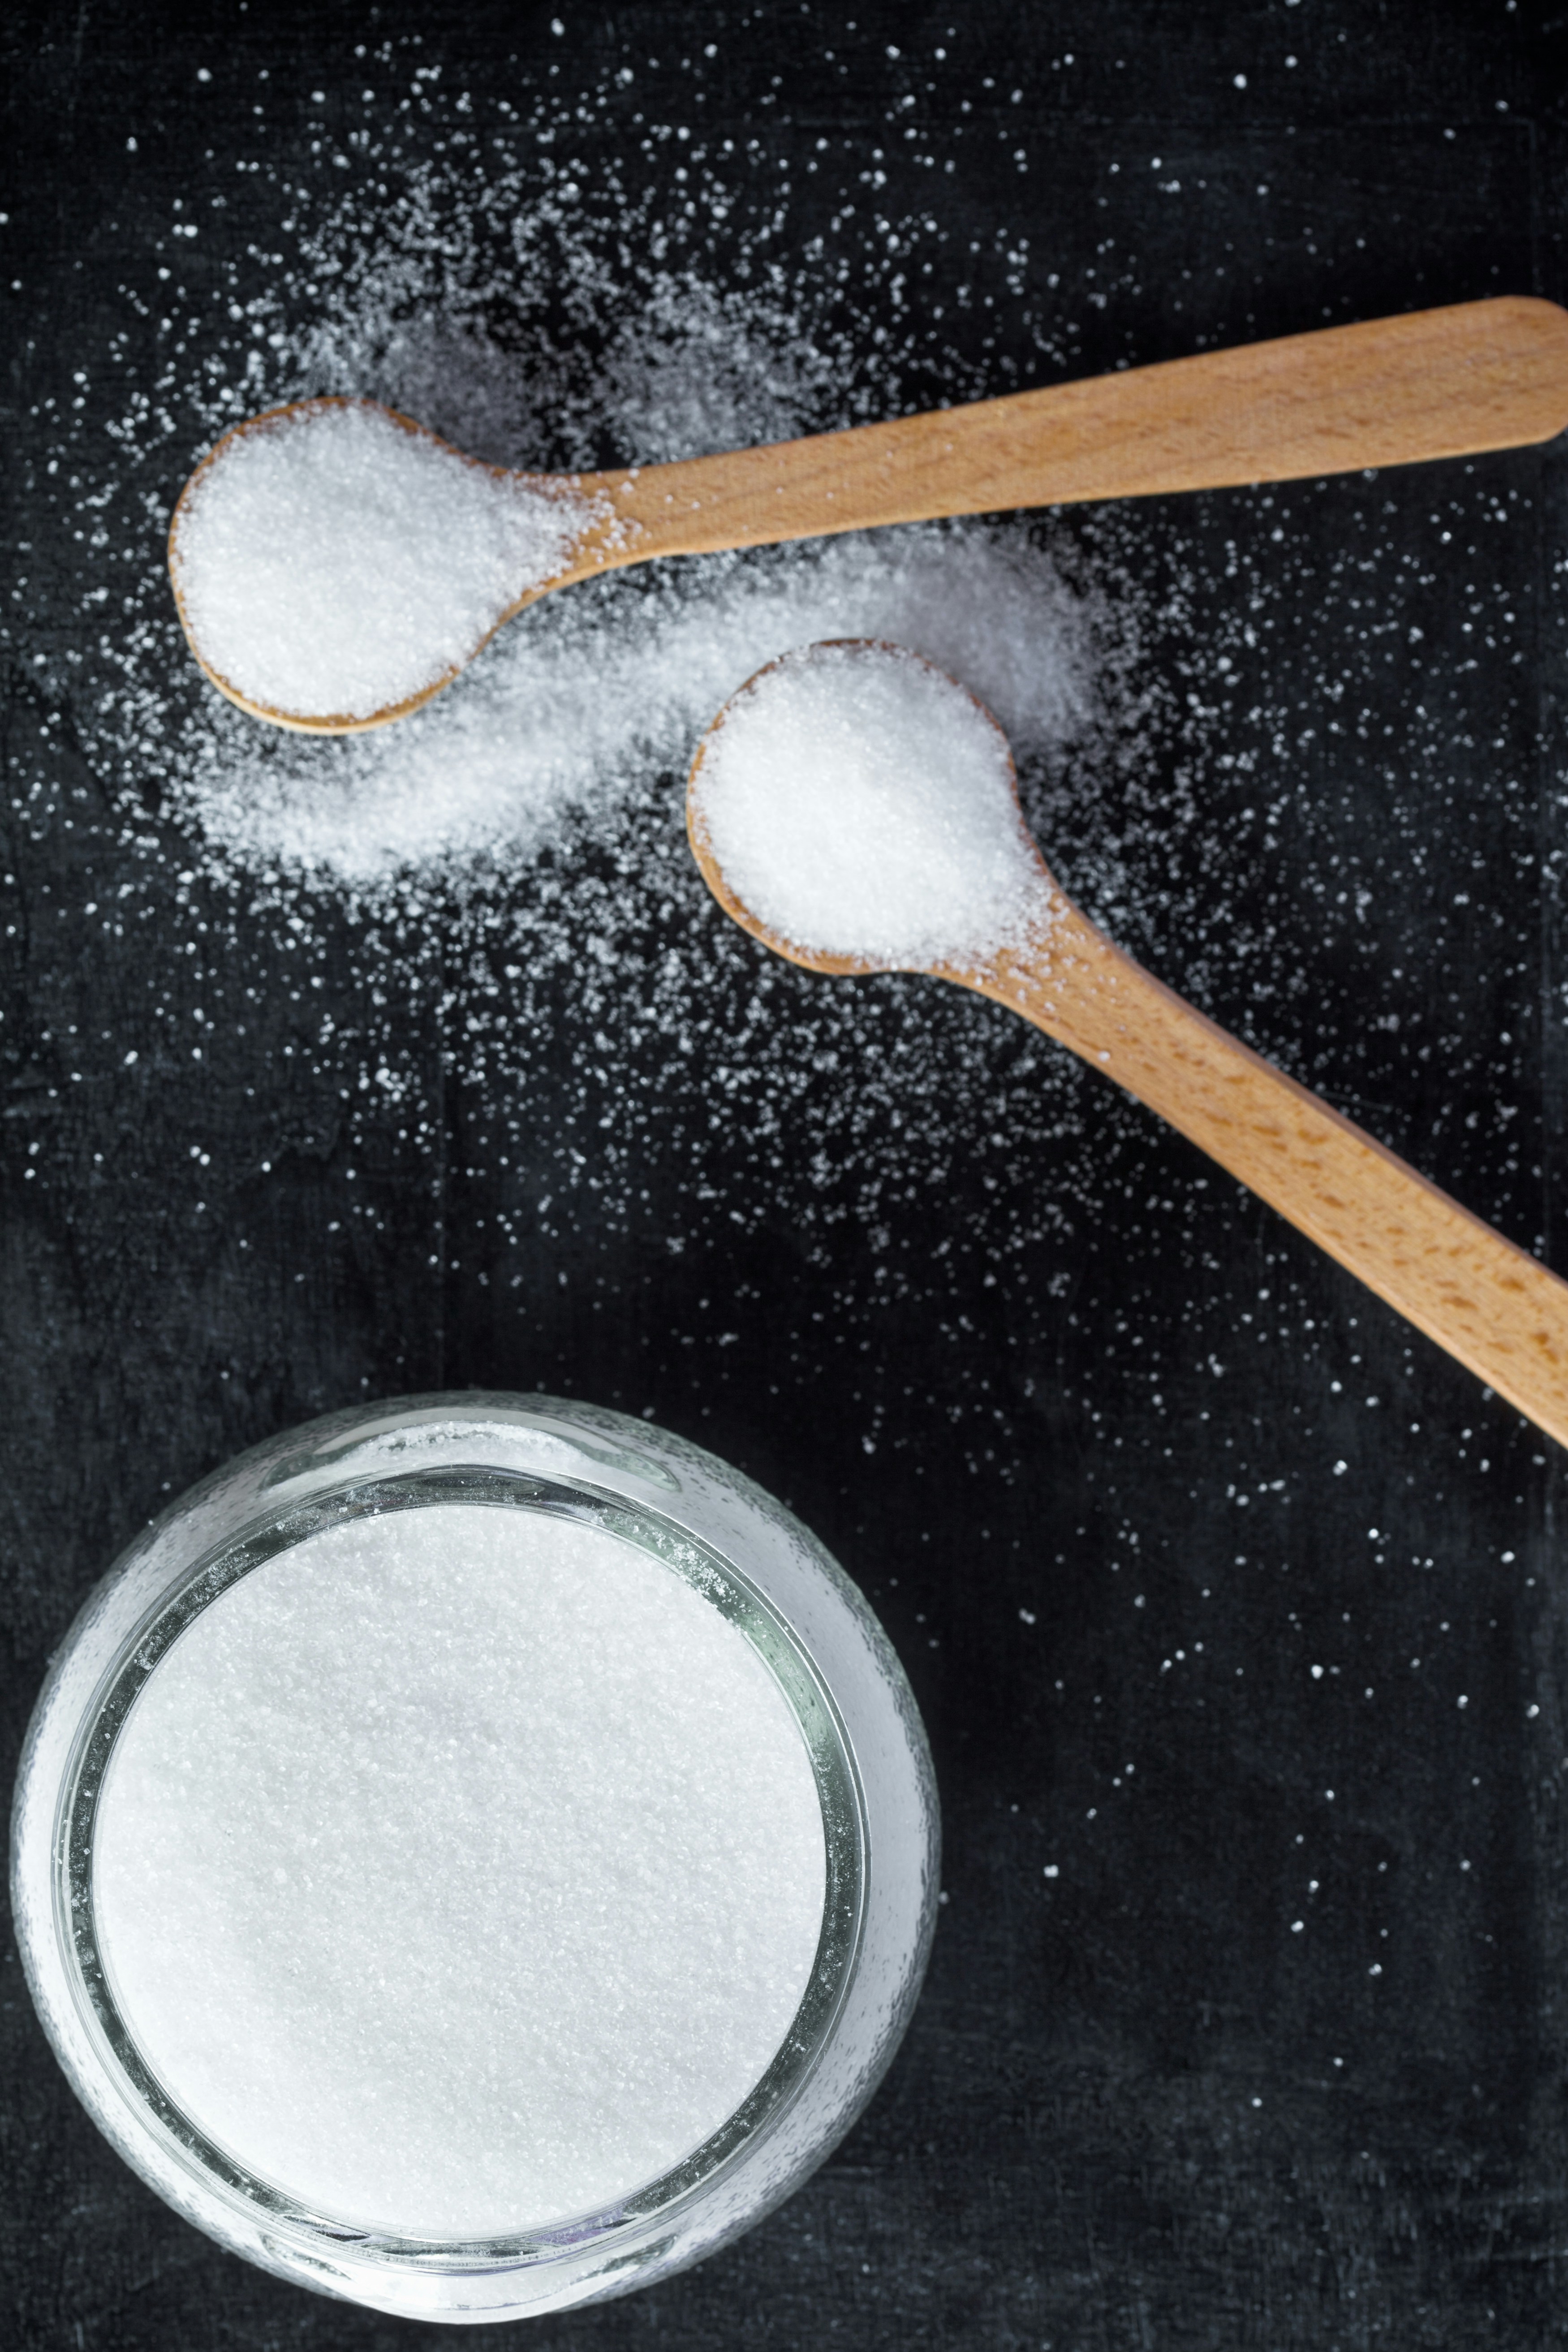
Sodium bicarbonate produced from soda ash via carbonation, so soda ash price is primary cost driver. Soda ash production energy intensive, requiring natural gas and electricity. Higher natural gas and power costs raised production expenses for producers, while weak demand limited operating rates in some regions, similar to caustic soda and acetic acid dynamics.
Energy pricing, environmental compliance, customer destocking cycles, and localized oversupply interacting at same time create sharper divergence between commoditized and specialty grades. That is why fine chemicals market in 2026 should be read by layer rather than aggregate.
Feedstock structure affects more than price, it can influence impurity profile, lot consistency, and production flexibility. For food-grade sodium bicarbonate, low iron and heavy metal, consistent particle size, and free-flowing properties require additional purification, adding conversion cost even when soda ash softens.
Logistics impact window 2 to 6 weeks affects landed cost, MOQ planning, and cash tied up in safety stock. That window matters for sodium bicarbonate where technical grade often shipped in bulk bags and food grade in 25 kg bags with PE liner, similar to calcium carbonate and zinc sulfate.
Trade Dynamics And Outlook
Market size 2026 at 15.10 billion dollars for acetic acid, but sodium bicarbonate market smaller, with technical-grade market valued at 830 million dollars with detergents and cleaning 22.24% share. Global sodium bicarbonate market experiencing steady growth driven by food, pharma, and flue gas treatment.
Trade flows show China as low-cost exporter at 177.78 dollars MT FOB, while import-dependent markets like India, Southeast Asia, and Africa pay premium due to freight and duties. Shanghai Containerized Freight Index 231% higher year-on-year in September 2026 adds to delivered costs, similar to polyethylene and acetic acid markets.
GCC countries adopted 12-digit HS codes January 1 2025 with precision tariffs for food chemicals, adding customs complexity and potential delays that increase logistics costs.
Pricing Outlook And Buyer Strategies
Don't expect sharp rebound in back half of 2026. Gradual, uneven recovery more likely. That outlook suggests base case 0 to 3% movement, pressure case 4 to 8% if energy costs rise, disruption case above 8% if supply tightens.
Practical strategies include tracking soda ash prices as leading indicator, monitoring energy costs for electrolysis and carbonation, and separating raw material trend from conversion trend. Build tiered budgets with base, pressure, and disruption cases. Require landed-cost comparison not ex-works only, as freight and fuel surcharges have become revenue lever for carriers, with LTL rate per pound index expected to reach 82.5% above January 2018 baseline.
Focus on four decision signals: input trend, lead-time movement, supplier capacity discipline, and compliance friction. When three move same direction for 6 to 8 weeks, probability of sustained price pressure rises. Suppliers mentioning allocation, maintenance shutdowns, packaging shortages, or shortened quotation validity signal uncertainty.
For food-grade buyers, confirm equivalent specifications before price benchmarking, as food grade premium over technical grade justified by purity, heavy metal compliance, and certifications like FSSC 22000, Halal, Kosher. Sodium bicarbonate food grade anchor at 30 to 35% of global consumption ensures steady demand, supporting firmer pricing even when industrial demand softens.
Sources:
Sodium Bicarbonate Price Trend 2026 Forecast – Food and beverage remains demand anchor 30 to 35% – Don't expect sharp rebound back half 2026 gradual uneven recovery – About 406 tonne globally Q2 2026 regional spread 284 China – https://expertmarketresearch.com
Sodium Bicarbonate Price Trend August 2026 – Procurement Resource – China FOB 177.78 MT – markets mixed Q2 2026 stable Asian supply firmer pricing import-dependent markets – https://procurementresource.com
Sodium Bicarbonate Price Trend Q2 2026 – GlobalRiskCommunity – clear upward movement most global markets – technical grade strong increases Southeast Asia – Thailand strongest 26% – https://globalriskcommunity.com
2-Ethylhexyl Acrylate
Found this useful?